Effective Cron Job Monitoring
In our modern world, automation is crucial for the seamless operation of all applications and systems. A vital tool for automation in Unix-based environments is the cron job. These scheduled tasks run autonomously at predetermined intervals, streamlining routine tasks like scheduled backups and updates, data ingestion and processing pipelines, and all sorts of machine learning workflows. By automating these processes, cron jobs reduce the load for system administrators while ensuring crucial tasks are executed consistently and on time.

Monitoring cron jobs is vital for sustaining a robust system. By closely observing their performance, you guarantee the smooth functioning of your automated tasks and swiftly address any issues. Taking this proactive approach allows for the detection and resolution of potential issues before they escalate, safeguarding your system.
Consistent monitoring can help you:
- Confirm tasks are running on schedule
- Detect performance bottlenecks or resource usage concerns
- Identify errors in tasks execution
- Maintain a record of task execution history for audit purposes
In this blog post, we’ll explore the significance of monitoring cron jobs, the challenges it entails, and the array of techniques and tools available for efficient monitoring. Throughout, we will include practical code examples and step-by-step instructions for implementation. Vigilantly overseeing your cron jobs will make you well-prepared to maintain a stable, high-performing system.
Frequent Cron Job Challenges
To help you pinpoint potential hurdles and adopt preventive measures for an efficient automated workflow, let’s take a look at some typical challenges that may emerge with cron jobs:
A. Execution Overlaps
Execution overlaps are a common issue, occurring when a task takes longer to finish than the interval between its scheduled runs. This causes multiple instances of the same task to operate concurrently, potentially leading to resource clashes, data corruption, or unpredictable application behavior.
B. Skipped or Unsuccessful Executions
Another hurdle in managing cron jobs is detecting skipped or unsuccessful executions. Skipped executions can arise from various causes, such as system downtime, inadequate resources, or improper configuration. Conversely, failed executions may stem from task-related issues, like script bugs or external dependency problems.
C. Excessive Resource Usage
Cron jobs occasionally demand substantial system resources like CPU, memory, or disk space, particularly when multiple tasks run concurrently or a task is resource-intensive. Excessive resource consumption can impair your system’s performance and other applications running on it.
D. Erroneous Scheduling
Improper scheduling of cron jobs can result in tasks running at unintended times or not at all. This might be due to typos, incorrect time expressions, or misconfigured time zones. Making sure your cron jobs are accurately scheduled is crucial for maintaining a stable system.
By identifying these common cron job obstacles, you can proactively implement solutions to prevent them, guaranteeing that your automated tasks run smoothly and bolster a reliable, high-performing system.
Cron Job Monitoring Approaches
Efficiently monitoring cron jobs enables you to detect and address issues before they negatively affect your system’s performance. In this section, we’ll explore various monitoring approaches, including log analysis, setting up notification alerts, and making use of third-party monitoring tools.
A. Log Analysis
Analyzing logs is a common method for monitoring cron jobs, providing valuable insights into task execution, performance, and potential issues. Key log types include:
- System Logs: These are generated by the operating system to offer information on overall system health and cron job entries.
- Application Logs: These are produced by applications or scripts, which assist in identifying errors or bottlenecks.
- Error and Exception Entries: These help pinpoint issues within tasks or dependencies.
By monitoring these logs, you can quickly detect and resolve problems before they negatively impact your system’s performance.
B. Email/Slack Notifications
Setting up email or slack notifications for your cron jobs is another effective monitoring strategy. Configure these notifications to send success and failure messages, keeping you informed about task status. You could also create custom templates with additional task information, such as execution time, resources used, or relevant logs, to help you gain a better understanding of task performance and status.
C. Third-Party Monitoring Tools
Beyond the aforementioned techniques, there is a variety of popular monitoring tools available, each offering unique features and benefits. Two such tools, Healthchecks.io and Cronitor, can help enhance your monitoring capabilities. The monitoring technique both tools employ is called “heartbeat monitoring” and serves as a type of dead man’s switch. Heartbeat monitoring involves sending periodic signals to indicate that the system is alive and functioning correctly. A dead man’s switch is a safety mechanism that activates when it stops receiving these signals, indicating a potential failure in the system.
Healthchecks.io
Healthchecks.io is a simple and lightweight monitoring service designed specifically for cron jobs, daemons, and scheduled tasks. The service actively monitors HTTP requests (“pings”) from your tasks and sends alerts if they fail or do not arrive as expected. Healthchecks.io features a live-updating dashboard, customizable alerts, and simple configuration with adjustable Period and Grace Time parameters. It also provides public status badges for easy integration into READMEs or status pages. With an open-source codebase, and options for free or self-hosted usage, Healthchecks.io offers a user-friendly setup process that makes it ideal for basic monitoring needs across personal and professional projects.
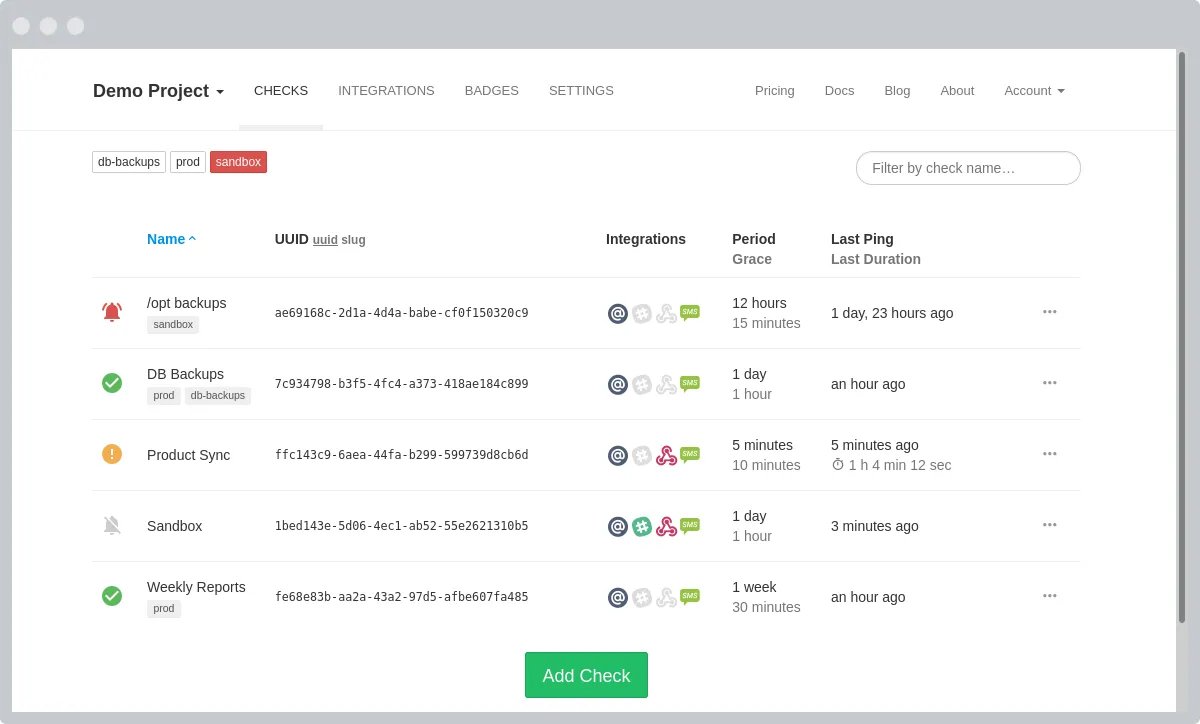
Healthcheck.io Dashboard
Example: Monitoring job execution and run time
To monitor a cron job using Healthchecks.io, follow these steps:
- Create a new Check in your Healthchecks.io account to get its unique id.
- Add an HTTP request (using curl or another HTTP client) to your cron job definition, which sends a “ping” to Healthchecks.io each time the cron job completes successfully.
Here’s an example of how to update a cron job definition for monitoring:
Original cron job:
# run myscript.sh at 06:09 every day
9 6 * * * /home/user/myscript.sh
Updated cron job with Healthchecks.io monitoring:
# run myscript.sh, then send a success signal to Healthchecks.io
9 6 * * * /home/user/myscript.sh && curl -fsS -m 10 --retry 5 -o /dev/null https://hc-ping.com/your-uuid-here
By adding the extra curl call, Healthchecks.io will track the received pings and notify you if a ping does not arrive on time. Remember to set an appropriate Grace Time, which is the extra time allowed for a cron job to complete before declaring it as down.
To measure script run time, you can use the `/start` endpoint along with the regular ping URL. This will indicate when a job starts and allows Healthchecks.io to track job execution times. The execution time is calculated as the time gap between adjacent “start” and “success” events.
For jobs using the `/start` signal, Healthchecks.io has an additional alerting rule: if a “success” signal is not received within the configured grace time after a “start” signal, the job is assumed to have failed, marked as “down,” and alerts are sent out.
Here’s a typical example in Python to measure script run time:
import requests
URL = "https://hc-ping.com/your-uuid-here"
# Send "/start" signal to start the timer
try:
 requests.get(URL + "/start", timeout=5)
except requests.exceptions.RequestException:
 # If the network request fails, don't prevent the main job from running
 pass
# Run the main job - Calculate the factorial of a number
def factorial(n):
 return 1 if n == 0 or n == 1 else n * factorial(n - 1)
number = 10
print("Factorial of %d = %d" % (number, factorial(number)))
# Send a "success" signal to indicate job completion
requests.get(URL)
In this example, the script sends a “/start” signal at the beginning of the job and a “success” signal upon completion. This enable tracking and calculating the job’s execution time.
Cronitor
Cronitor is a comprehensive monitoring service designed for cron jobs and background tasks, providing 360° monitoring coverage for processes capable of making or receiving network requests. With Cronitor, you can track each execution, correlating exit status, metrics, and logs in one convenient location. The platform offers features such as a real-time dashboard, metrics and logs analysis, incident management, and customizable status pages. Cronitor offers a free trial and various pricing plans to cater to your specific monitoring needs.
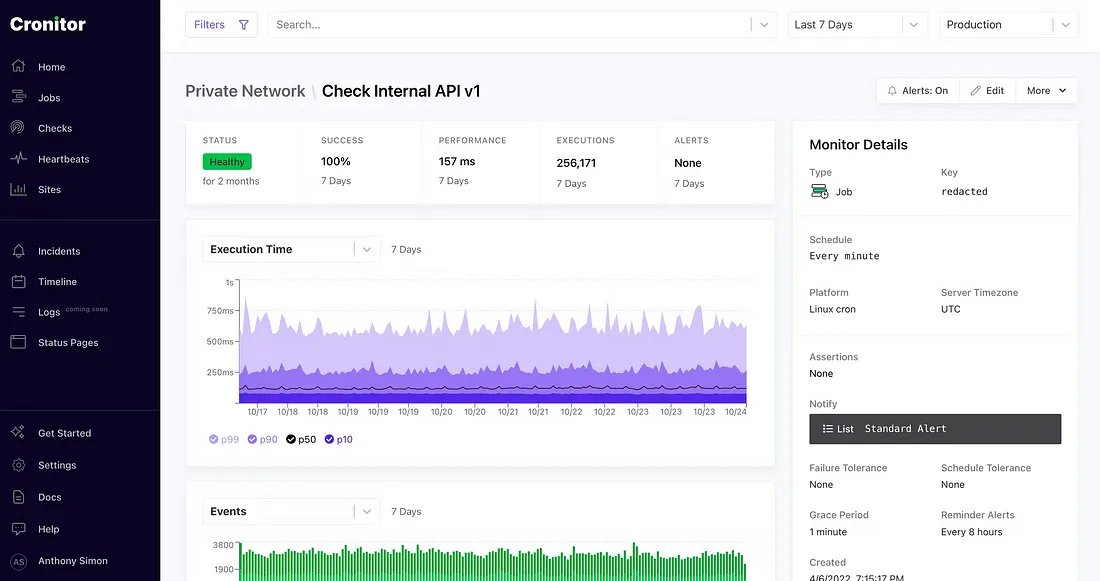
Cronitor Dashboard
Example: Monitoring Airflow DAGs
Let’s now take a look at an example for how to use Cronitor to monitor Airflow DAGs:
- Installation: Install the Cronitor Airflow provider package using pip:
pip install apache-airflow-providers-cronitor
- Create a connection: Set up an Airflow connection to store your Cronitor API key. You can do this using the Airflow UI or a Secrets Backend.
- Import the CronitorOperator: In your DAG script, import the
CronitorOperator:
from cronitor_airflow.operators.cronitor_operator import CronitorOperator
Here’s a typical DAG example of using the operator:
from airflow import DAG
from datetime import timedelta, datetime
from cronitor_airflow.operators.cronitor_operator import CronitorOperator
import time
from airflow.operators.python import PythonOperator
def factorial(n):
 return 1 if n == 0 or n == 1 else n * factorial(n - 1)
with DAG(
 'cronitor_monitoring_example',
 description='this is a test dag',
 schedule_interval='9 6 * * *',
 catchup=False,
 default_args={
 'monitor_key': 'your_monitor_key',
 },
 start_date: datetime(2020, 01, 01)

 ) as scheduled_dag:
start = CronitorOperator(
 task_id='cronitor-start',
 state='run',
 )
factorial_op = PythonOperator(
 task_id='get_factorial',
 python_callable=factorial,
 op_args=[10]
 )
end_success = CronitorOperator(
 task_id='cronitor-end-succeed',
 state='complete',
 trigger_rule='all_success',
 )
end_failure = CronitorOperator(
 task_id='cronitor-end-failure',
 state='fail',
 trigger_rule='one_failed',
 )
start >> factorial_op >> [end_success, end_failure]
In the provided code, there are three CronitorOperator instances used for monitoring Airflow tasks. The start instance sends a 'run' state signal when the workflow begins execution. The end_success instance sends a 'complete' state signal when all upstream tasks succeed, while the end_failure instance sends a 'fail' state signal when any upstream task fails.
Monitoring Metrics and Thresholds
To effectively monitor your cron jobs, it’s essential to track the appropriate metrics and establish alerts to notify you of any issues. In this section, we’ll explore the key performance indicators (KPIs) for cron jobs and how to determine suitable thresholds.
A. Key Performance Indicators (KPIs)
To gauge the health and performance of your cron jobs, monitor the following KPIs:
Execution Time
Execution time measures the duration required for a cron job to finish. Monitoring this metric helps identify tasks taking longer than expected, potentially indicating performance bottlenecks or overlapping executions.
Resource Usage
Resource usage covers the consumption of CPU, memory, and disk space by your cron jobs. Monitoring resource usage helps pinpoint resource-intensive tasks that may affect your system and other applications’ performance.
Success/Failure Rate
The success/failure rate compares the number of successful cron job executions to the total runs. A high failure rate might suggest issues with tasks or dependencies, warranting further investigation.
B. Setting Thresholds
After identifying relevant KPIs, it is crucial to establish suitable thresholds to help detect issues and prevent false alarms. Thresholds are predetermined values that indicate when a metric has crossed a particular threshold and indicates a problem that needs attention.
Thresholds play a key role in detecting system bottlenecks by monitoring metrics like execution time and resource usage. For example, if a cron job exceeds its time threshold, it could signal a performance issue. But beware, overly narrow thresholds can cause false alarms. So, it’s crucial to set realistic thresholds based on historical data and typical job behavior, mitigating false alarms while accurately flagging potential issues.
Properly setting thresholds is a crucial part of monitoring cron jobs effectively. By identifying the appropriate KPIs and setting suitable thresholds, you can detect potential issues before they escalate and maintain the smooth functioning of your automated tasks.
Cron Job Monitoring Best Practices
To turbocharge your cron job monitoring and keep your system performing at its peak, you could make use of the following best practices:
A. Proper Documentation
Comprehensive documentation of your cron jobs is critical for understanding their purpose, dependencies, and configuration. This includes documenting schedule expressions, the tasks they perform, and any external dependencies. Proper documentation aids in troubleshooting issues more efficiently and makes it easier for team members to comprehend and maintain the system.
B. Regular Reviews and Audits
Conducting regular reviews and audits of your cron jobs helps identify and address issues before they escalate. This includes checking for outdated or unused jobs, verifying correct schedule expressions, and ensuring all dependencies are up to date.
C. Separating Critical and Non-Critical Jobs
Categorizing your cron jobs based on their criticality helps prioritize monitoring efforts and allocate resources effectively. By distinguishing critical jobs impacting essential system functions from non-critical jobs, you can focus on tasks most vital to your system’s stability and performance.
D. Scalability and Optimization Considerations
As your system expands and evolves, consider the scalability and optimization of your cron jobs. This may involve distributing tasks across different machines, staggering resource-intensive job execution, or re-architecting your system to handle increasing workloads.
E. Establishing a Monitoring and Alerting Strategy
A robust strategy for monitoring and alerting is key to maintaining your cron jobs’ health and performance. By choosing the right KPIs, setting suitable thresholds, and integrating with alerting systems, you can proactively tackle issues, ensuring smooth task automation.
Conclusion
In this post, we explored the significance of effective cron job monitoring and its impact on system stability, performance, and continuous improvement. Effective monitoring is crucial for smooth task functioning, early issue detection, and proactive problem resolution. Monitoring also aids in maintaining system performance by quickly identifying resource-intensive tasks and bottlenecks. As your system evolves, it’s essential to continuously improve and adapt your monitoring strategies, staying informed about new tools and best practices to maximize effectiveness. Ultimately, implementing the practices discussed here will ensure your automated tasks run efficiently, allowing you to focus on driving value and growth for your organization.