Detecting Data Drift with Machine Learning
Understand degraded performance of your ML models with an easy, automated process

Hennie de Harder

Data changes over time. This is often unpredictable and unannounced. These changes cause a model based on old data to be inconsistent with new data. The performance of the model degrades and you need to retrain the model, enhanced with new data. In this post, the three different types of data drift are explained, along with ways to detect them.

Car drifting. Photo by Arthur Poulin on Unsplash.
In finance, machine learning models are used to detect fraudulent transactions. These models need to be updated on a regular basis, because fraudsters discover new ways to commit fraud, data input changes or other unforeseen events happen that impact the model. If behaviour of fraudsters changes, it’s important for the data analysts to know what the new behaviour is, so they can use this in the analysis of flagged transactions.
Data scientists are aware of the fact that the performance of machine learning models decreases over time. Unpredictable things happen that have impact on the input data, and because of that you can’t trust your model to keep the same performance it had in the beginning. The easiest way for retraining is creating an automated process that retrains the model on a schedule. The process compares the performance of the new model with the performance of the previous model and uses the model with the best performance. One step further is monitoring performance. You can decide to retrain your model when the performance falls below a certain threshold:
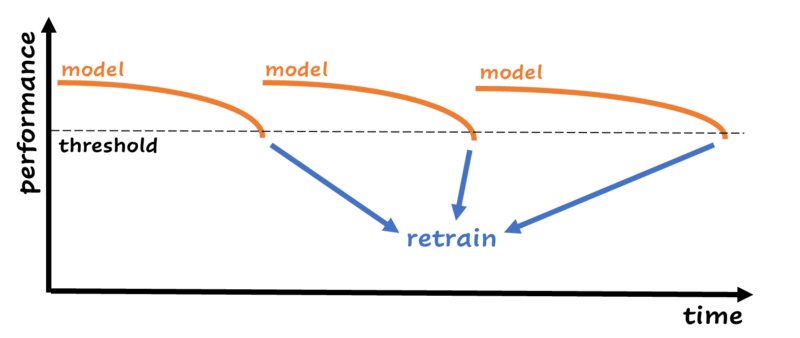
When performance drops below a certain threshold, the model is retrained with new data. This is just an example; in real life this chart can look in many different ways. Image by author.
Retraining on a schedule or when the performance drops below a threshold are the most basic ways of detecting that your model needs an upgrade. In most cases this is enough. But, by only looking at performance, you have no idea why the model is performing worse than before. Let’s look at the example about the fraudsters discovering new ways to commit fraud. It’s important for the analysts to have information about their behaviour, so they can act upon it. In this case, it’s better to have a process in place that gives you a clue about what’s happening with the data to be aware of new patterns.
Sometimes, it can be hard to set up performance monitoring. The data can be delayed, for example when you predict something a month from now. And a model can be expensive to retrain. When your model is a large deep neural network for which the training time is hours or days, you don’t want to spend many resources on retraining every week. The processes described in this article for detecting data drift use simple machine learning models and a sample of the data, it’s efficient and fast.
The types of data drift and how to detect them
Most known ways of data drift monitoring are based on monitoring single features with t-tests or ANOVA. These methods aren’t good enough, because the relationships between features can also shift, while the single feature distributions stay the same.
Machine learning to the rescue! Two out of three drift types are easy to detect with machine learning. And the third type doesn’t need fancy detection methods. By setting an alert when drift happens, you can directly dive in and do what is necessary to handle the drift.
In the following paragraphs, I will explain the different types of data drift. The types are illustrated with examples from a financial institution.
Covariate drift
A fundamental assumption of a supervised machine learning model is: Train and test data should be drawn from the same population or distribution. If this is not the case, the performance will degrade, and you can’t rely on the predictions of your machine learning model. A shift in the independent variables, or the features, is called covariate drift.
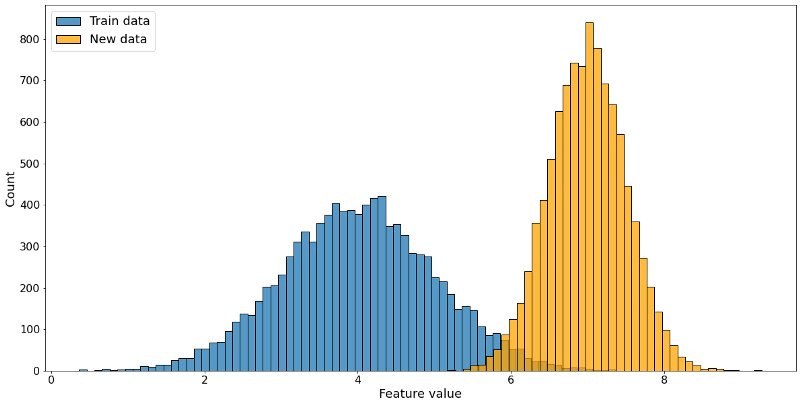
Train data distribution in blue, new data distribution in orange. The distributions are different, this feature is drifting. Image by author.
Financial transactions are divided into different types. Transaction types play a part in detecting fraudulent transactions with machine learning algorithms, because a transaction type ‘buying groceries’ differs from a transaction with type ‘online gambling’. Every now and then, the transaction types are updated: types are merged or removed, or new types are added. If the model isn’t aware of the new transaction types, it’s possible to miss fraudulent transactions within the new or changed types, because it has never seen them before.
The example above shows the importance of having a covariate drift check in place. You can check if the data from a certain period is roughly the same as the data you received the period before. You can run the process every day, week, or month, depending on the amount of data and the periodicity. If the amount of data is really high, you can decide to take a sample of the data, instead of the complete set. The process is illustrated below:
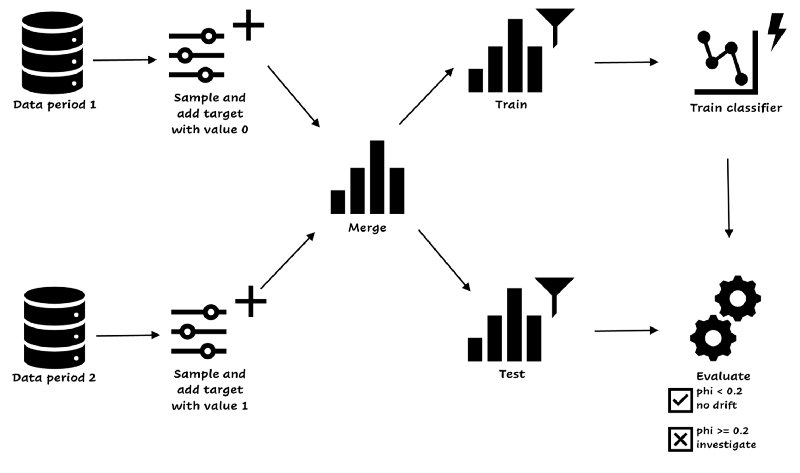
Covariate drift detection. Image by author.
You start with two datasets from the periods you want to compare, without the label, because we’re considering only the features in covariate drift. You take a sample of both datasets. The easiest way is to take samples of equal size (or you need to correct the evaluation metric). You add the target variable, 0 for the old data and 1 for the new data. You merge the datasets and create train and test sets. Then, you train a simple classifier on the train set and evaluate the model on test. If the phi-coefficient is equal to 0.2 or higher, the model can find at least a weak relationship between the sets and labels[1], and you have to handle the drift. If the phi-coefficient is smaller than 0.2, you’re good, the model can’t find patterns and there’s no covariate drift.
Benefits of this process are that it’s easy and takes a short amount of time, because of the sampling and the simplicity of the classifier (you can take a decision tree or a small neural network depending on your data).
Concept drift
When the relationship between the features and the target variable changes, it’s called concept drift. An example to illustrate this:
Suppose you are building a model to predict fraudulent transactions, where the target is binary (the transaction is fraudulent or okay). After deploying the model, you need to keep track of performance. Why? Because this model needs updates from time to time: Fraudsters will find new ways to commit fraud, and if methods don’t work anymore (because they get caught) they will stop using these methods. The relationship between input (features) and target changes. Let’s say a fraudster discovers that amounts above 1000 euros are suspicious and detected, he will change his behavior to lower amounts, but it will still be fraud.
Concept drift can come in different forms or graduations. You can have a sudden change, an incremental change or a recurring change. This matters, because different graduations need different ways to handle the drift. Sometimes it can be hard to say if the change will continue.
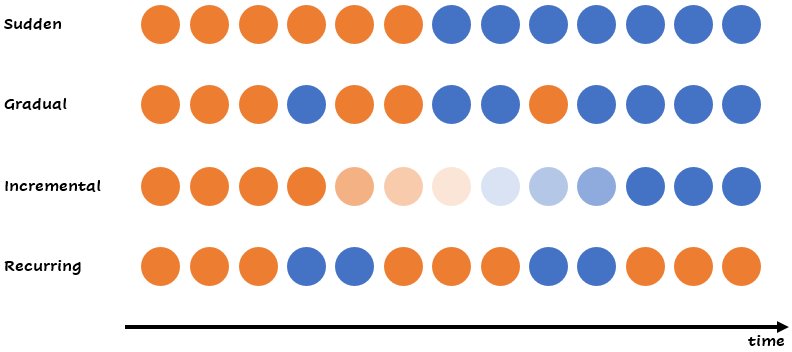
Different forms of concept drift. Within a similar group, the relationship between the target variable can change. Image by author.
It’s possible to detect concept drift with machine learning. You create an anomaly detector on the train set (with label!), and every once in a while, depending on the periodicity of your data, you run it again. You use the anomaly score’s distribution of a batch with new data and compare it to the distribution of the old data. If there is a significant change between the distributions, you should decide to retrain the model.
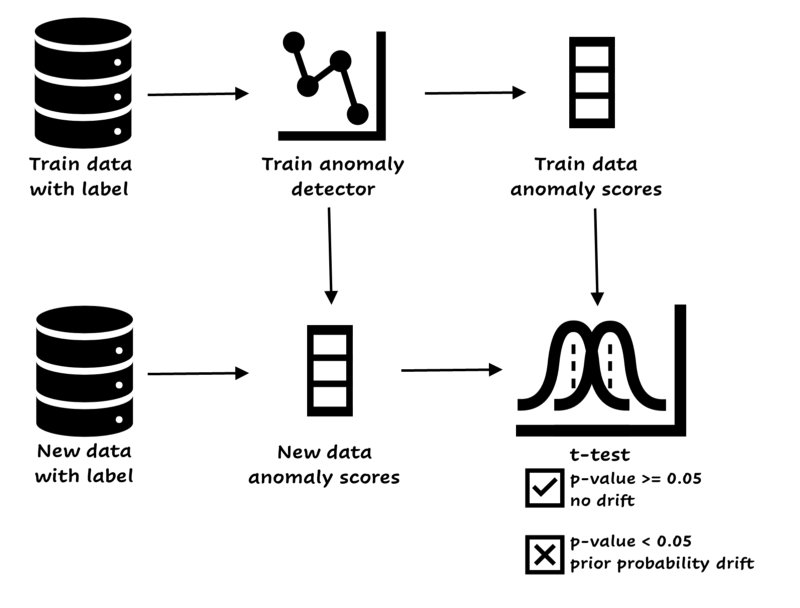
Easy concept drift detector. Image by author.
If your feature space is really large, you can decide to add a dimensionality reduction model like PCA or UMAP to the training features, add the label and continue the process (train anomaly detector, and so on). This ensures that the drift is about the relationship between the features and the target variable. The benefits of this approach are that a small model is used, and you can perform a statistical test between the anomaly scores. If you already have a small model and can manage performance directly, there’s no need to set up this process.
Besides this approach, there are other methods available like ADWIN, EDDM and Page-Hinkley. Scikit-multiflow has some nice implementations.
It might be possible that you don’t have access to the labels, or that they come with a considerable delay. Here’s an interesting paper that explains a method to detect concept drift without labels.
Prior probability drift
This occurs when the target variable shifts, and the model is not able to predict this based on the current features.
You build a model to predict the amount of cash in an ATM. Suddenly, the prediction is too low for a couple of days and you receive complaints. You discover there was a festival during those days. The target was shifted, because the amount of cash was a lot higher than expected. Depending on the recurrence of the festival, you can add features to your model or decide to leave the model as is.
The example shows a sudden change in the target variable (after the event everything will probably go back to normal), while it’s also possible to have gradual drift.
The target is only one variable, so it is easy to detect this type of drift. You can use a statistical test of mean difference to detect prior probability drift, like the t-test or ANOVA:
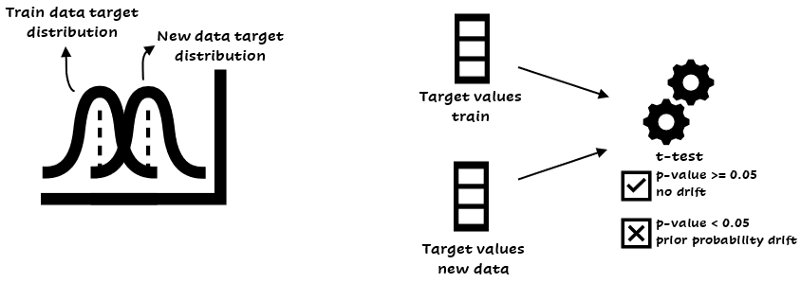
Detecting prior probability drift. Based on the target values you can perform a t-test.
The code below is a way to perform a t-test in Python:
from scipy.stats import ttest_ind
ttest_ind(y_values_train, y_values_newdata)

Everything changes over time. Photo by Aron Visuals on Unsplash
How to handle data drift?
After detection, how should you handle data drift? There’s no one size fits all answer here. You have several options depending on the type of drift and other factors.
The first step is investigation. If you’re dealing with covariate drift, you can easily detect features with a high model impact, for instance by using the feature importance, permutation importance or shap. You can decide to remove drifting variables from the model (if they have a low impact on performance). If the features are important, or you don’t have that much time, you can choose to retrain the model enhanced with new data. Another solution for covariate drift might be to use sample reweighting. This technique makes the distribution of the training data similar to the distribution of the test data. You have to reweight every training point in the learning process.
Especially with concept drift, it’s important to retrain or remodel. If you don’t have enough resources to create a data drift detection pipeline, you can decide to passively take care of data drift. This means you retrain the model continuously when new data is coming in. This is a good strategy when the data drifts gradually. An active detection system only retrains when the data is drifting.
Prior probability drift depends on the case. If an event with an impact on the target variable is not captured in the training data, you might want to add a feature in case the event will happen again. But if the drift is truly unpredictable, it’s harder to handle.
Summary
Sometimes, retraining on a schedule isn’t enough for machine learning models. If the model is too important and behaviour needs to be detected (like with the analysts and fraudsters), you want to be aware of changes in your data and the reasons of a dropping performance. Other reasons to create a data drift detection process are delayed labels or a model that is expensive to retrain.
The three main types of data drift are covariate, concept and prior probability drift. You can detect covariate and concept drift with machine learning. There are packages available that can take care of drift. Prior probability drift is easier to detect but can be harder to handle.
Different ways to handle data drift are retraining, remodelling, removal of drifting features or with sample reweighting.
References
[1] Yule, G. U. (1912). J. R. Statist. Soc., 75, 576–642. (On the methods of measuring the association between two variables. The first identification of the phi-coefficient.)